文件操作 - README.md
返回文件管理
返回主菜单
删除本文件
文件: /usr/local/src/netdata/web/gui/README.md
编辑文件内容
<!-- --- title: "The standard web dashboard" date: 2020-05-04 custom_edit_url: https://github.com/netdata/netdata/edit/master/web/gui/README.md --- --> # The standard web dashboard The standard web dashboard is the heart of Netdata's performance troubleshooting toolkit. You've probably seen it before: 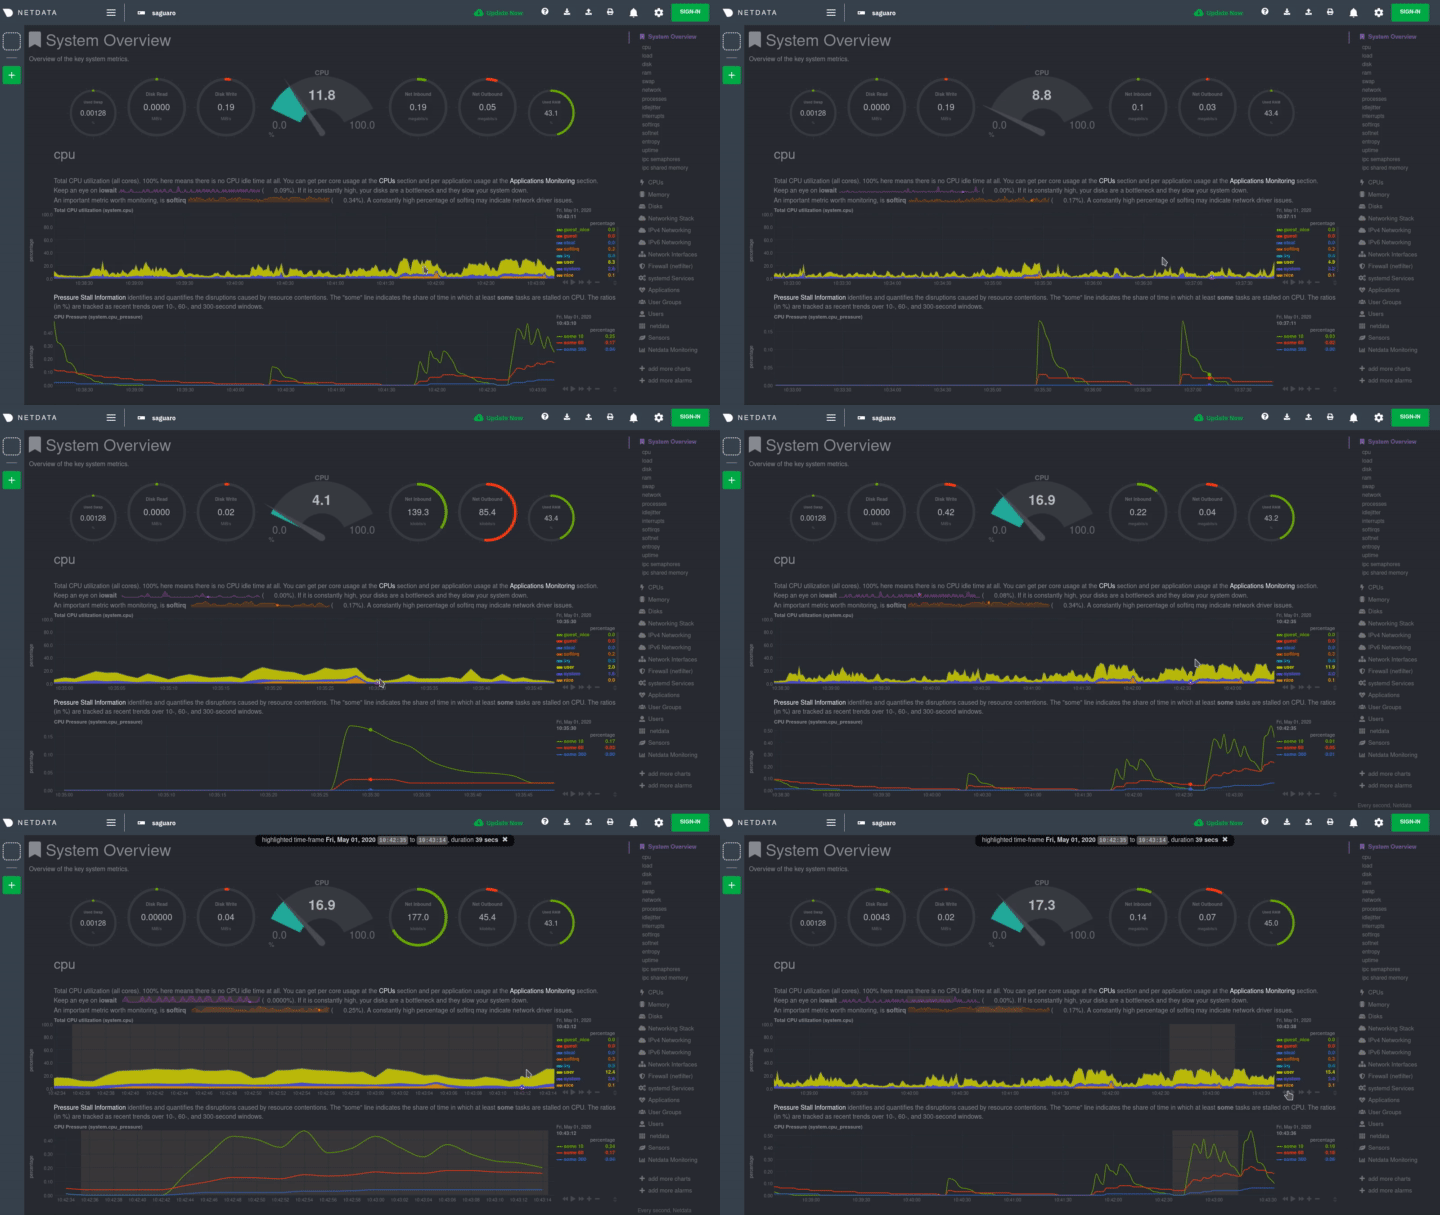 Learn more about how dashboards work and how they're populated using the `dashboards.js` file in our [web dashboards overview](/web/README.md). By default, Netdata starts a web server for its dashboard at port `19999`. Open up your web browser of choice and navigate to `http://NODE:19999`, replacing `NODE` with the IP address or hostname of your Agent. If you're unsure, try `http://localhost:19999` first. > In v1.21 of the Agent, we replaced the legacy dashboard with a refactored dashboard written in React. By using React, > we simplify our code and give our engineers better tools to add new features and fix bugs. The only UI change with > this dashboard is the top navigation and left-hand navigation for [Cloud integration](/docs/agent-cloud.md). The old > dashboard is still accessible at the `http://NODE:19999/old` subfolder. Netdata uses an [internal, static-threaded web server](/web/server/README.md) to host the HTML, CSS, and JavaScript files that make up the standard dashboard. You don't have to configure anything to access it, although you can adjust [your settings](/web/server/README.md#other-netdataconf-web-section-options) in the `netdata.conf` file, or run Netdata behind an Nginx proxy, and so on. ## Navigating the standard dashboard Beyond charts, the standard dashboard can be broken down into three key areas: 1. [**Sections**](#sections) 2. [**Metrics menus/submenus**](#metrics-menus) 3. [**Cloud menus: Spaces, War Rooms, and Visited nodes)**](#cloud-menus-spaces-war-rooms-and-visited-nodes)  ### Sections Netdata is broken up into multiple **sections**, such as **System Overview**, **CPU**, **Disk**, and more. Inside each section you'll find a number of charts, broken down into [contexts](/web/README.md#contexts) and [families](/web/README.md#families). An example of the **Memory** section on a Linux desktop system.  All sections and their associated charts appear on a single "page," so all you need to do to view different sections is scroll up and down the page. But it's usually quicker to use the [menus](#metrics-menus). ### Metrics menus **Metrics menus** appears on the right-hand side of the standard dashboard. Netdata generates a menu for each section, and menus link to the section they're associated with. 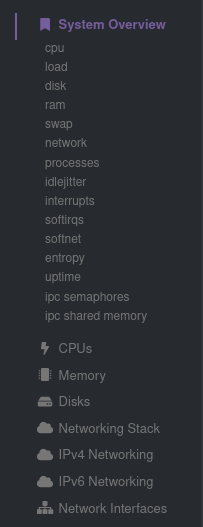 Most metrics menu items will contain several **submenu** entries, which represent any [families](/web/README.md#families) from that section. Netdata automatically generates these submenu entries. Here's a **Disks** menu with several submenu entries for each disk drive and partition Netdata recognizes. 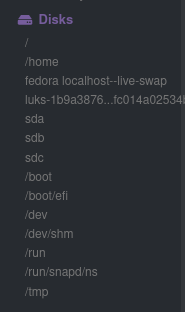 ### Cloud menus (Spaces, War Rooms, and Visited nodes) The dashboard also features a menu related to Cloud functionality. You can view your existing Spaces or create new ones via the vertical column of boxes. This menu also displays the name of your current Space, shows a list of any War Rooms you've added you your Space, and lists your Visited nodes. If you click on a War Room's name, the dashboard redirects you to the Netdata Cloud web interface. 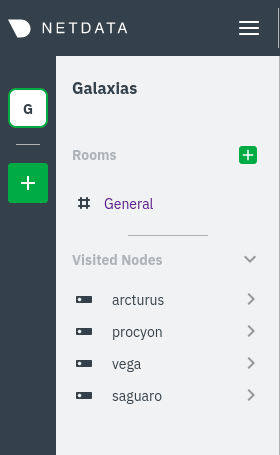 If you want to know more about how Cloud populates this menu, and the Agent-Cloud integration at a high level, see our document on [using the Agent with Netdata Cloud](/docs/agent-cloud.md). ## Customizing the standard dashboard Netdata stores information about individual charts in the `dashboard_info.js` file. This file includes section and subsection headings, descriptions, colors, titles, tooltips, and other information for Netdata to render on the dashboard. For example, here is how `dashboard_info.js` defines the **System Overview** section. ```javascript netdataDashboard.menu = { 'system': { title: 'System Overview', icon: '<i class="fas fa-bookmark"></i>', info: 'Overview of the key system metrics.' }, ``` If you want to customize this information, you should avoid editing `dashboard_info.js` directly. These changes are not persistent; Netdata will overwrite the file when it's updated. Instead, you should create a new file with your customizations. We created an example file at `dashboard_info_custom_example.js`. You can copy this to a new file with a name of your choice in the `web/` directory. This directory changes based on your operating system and installation method. If you're on a Linux system, it should be at `/usr/share/netdata/web/`. ```shell cd /usr/share/netdata/web/ sudo cp dashboard_info_custom_example.js your_dashboard_info_file.js ``` Edit the file with your customizations. For example: ```javascript customDashboard.menu = { system: { title: "Testing, testing, 1 2 3", icon: '<i class="fas fa-thumbs-up"></i>', info: "This is overwritten info for the system overview section!" } }; ``` Finally, tell Netdata where you placed your customization file by replacing `your_dashboard_info_file.js` below. ```conf [web] custom dashboard_info.js = your_dashboard_info_file.js ``` Once you restart Netdata, refresh the dashboard to find your custom configuration: 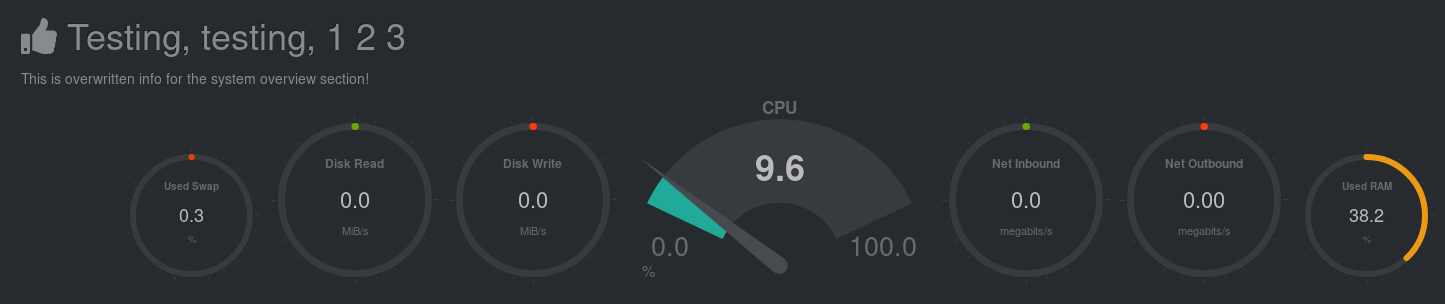 ## Custom dashboards For information on creating custom dashboards from scratch, see the [custom dashboards](/web/gui/custom/README.md) or [Atlassian Confluence dashboards](/web/gui/confluence/README.md) guides. []()
修改文件时间
将文件时间修改为当前时间的前一年
删除文件